Orange学习 |
您所在的位置:网站首页 › orange 数据 › Orange学习 |
Orange学习
|
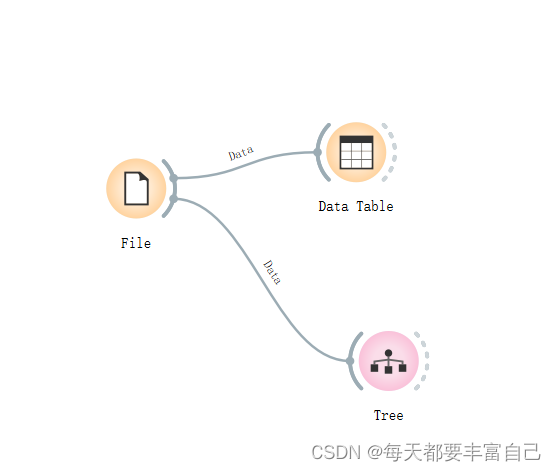
目录 1. 使用Model下的Tree 2. 操作步骤 2.1 新建File,导入数据集 2.2 查看数据 2.3 进入到Tree模型 2.4 进入到Tree Viewer 2.5 进行Test and Score 2.6 保存一下文件 使用决策树(Tree)模型对鸢尾花数据进行预测 1. 使用Model下的Tree使用的数据集:鸢尾花数据集(这是很经典的机器学习的数据集 sklearn中的)是classification问题 Tree 模型,也就是常说的决策树模型,可处理离散型数据与连续型数据,可用于classification和Regression 英文介绍: Tree is a simple algorithm that splits the data into nodes by class purity (information gain for categorical and MSE for numeric target variable). It is a precursor to Random Forest. Tree in Orange is designed in-house and can handle both categorical and numeric datasets. 2. 操作步骤 2.1 新建File,导入数据集
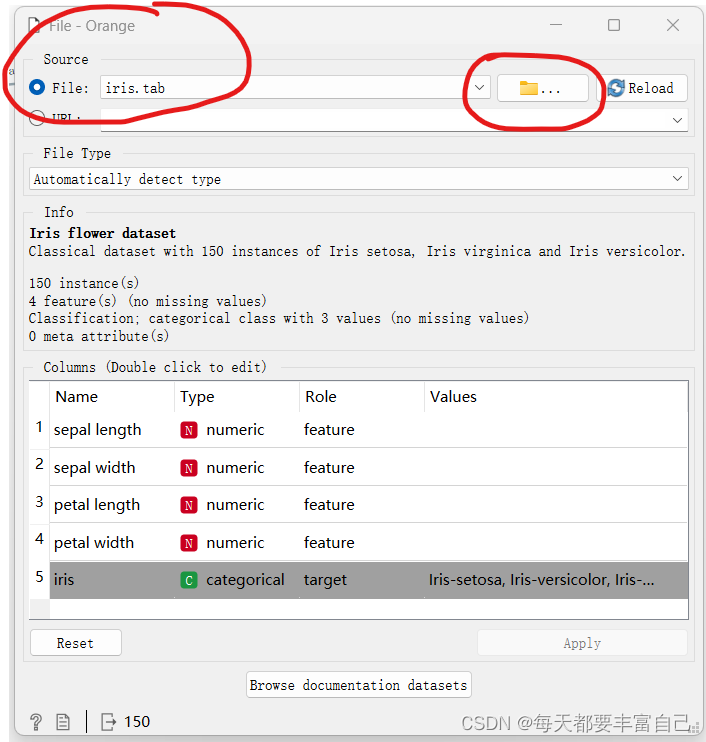
双击进入File,显示如下图所示:
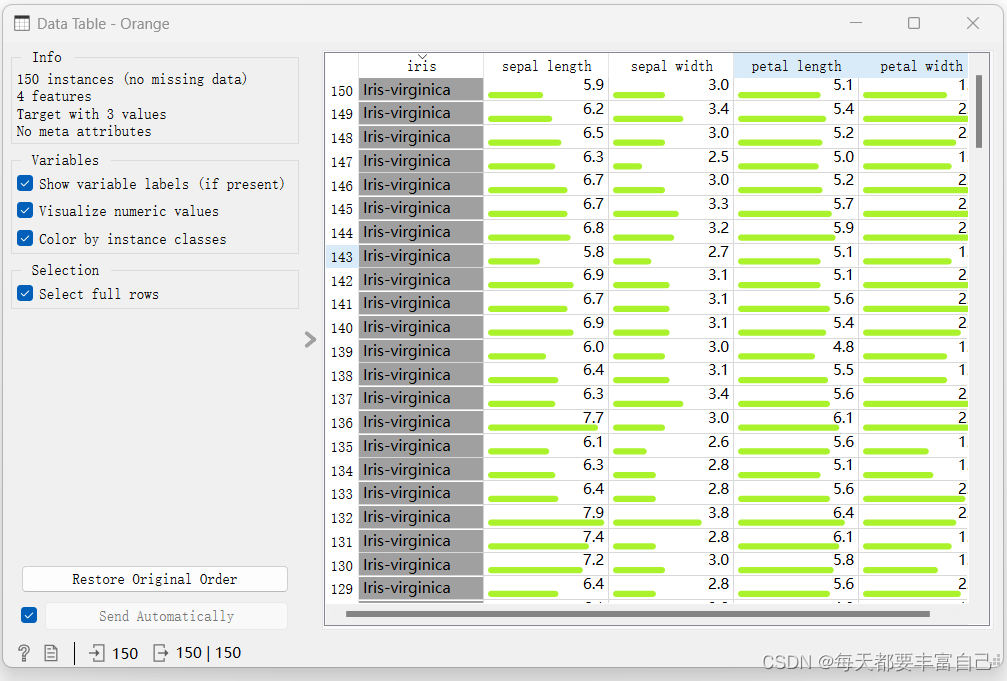
鸢尾花数据集是Orange所带的,可以直接load,如果是自己的数据,可以直接选择自己的文件即可 从上图可看出,Feature有四个,分别为sepal length\sepal width\petal length\petal witdth,它们的类型为numeric(数值型)target为iris,value分别为Iris-virginica\vesicolor\setosa 点击Apply,进入下一步 2.2 查看数据双击Data Table,即可进入到如下图所示的界面,整个数据集如下:
双击进入到Tree模型
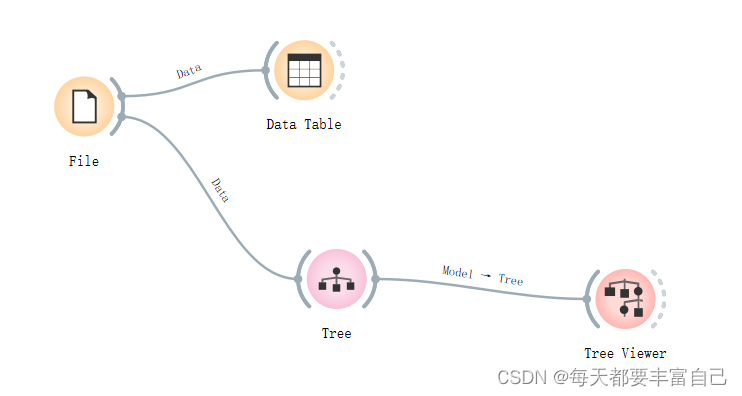
Tree parameters 介绍: Induce binary tree:build a binary tree 建立一个二叉树Min. number of instances in leaves: if checked, the algorithm will never construct a split which would put less than the specified number of training examples into any of the branches. 一个叶节点要存在所需要的最小样本量。一个节点在分支后的每一个子节点中,必须包含至少 Min. number of instances in leaves 个训练样本,否则分支就不会发生。这个参数可能会使得模型更平滑,尤其是在Regression中Do not split subsets smaller than: forbids the algorithm to split the nodes with less than the given number of instances 是一个中间节点要分支所需要的最小的样本量,如果一个节点包含的样本量小于Do not split subsets smaller than 中所填写的数字,这个节点分支就不会发生,也就是说,这个节点一定会成为一个叶子节点Limit the maximal tree depth: limits the depth of the classification tree to the specified number of node levels. 树的最大深度,这个参数越大,树的分支就会越多,计算量就会越大,会出现过拟合的现象,这个参数与Do not split subsets smaller than共同作用,先满足哪个限制条件,都会停止继续分支Stop when majority reaches [%]: stop splitting the nodes after a specified majority threshold is reached 2.4 进入到Tree Viewer添加Tree Viewer到流程中,如下图所示:
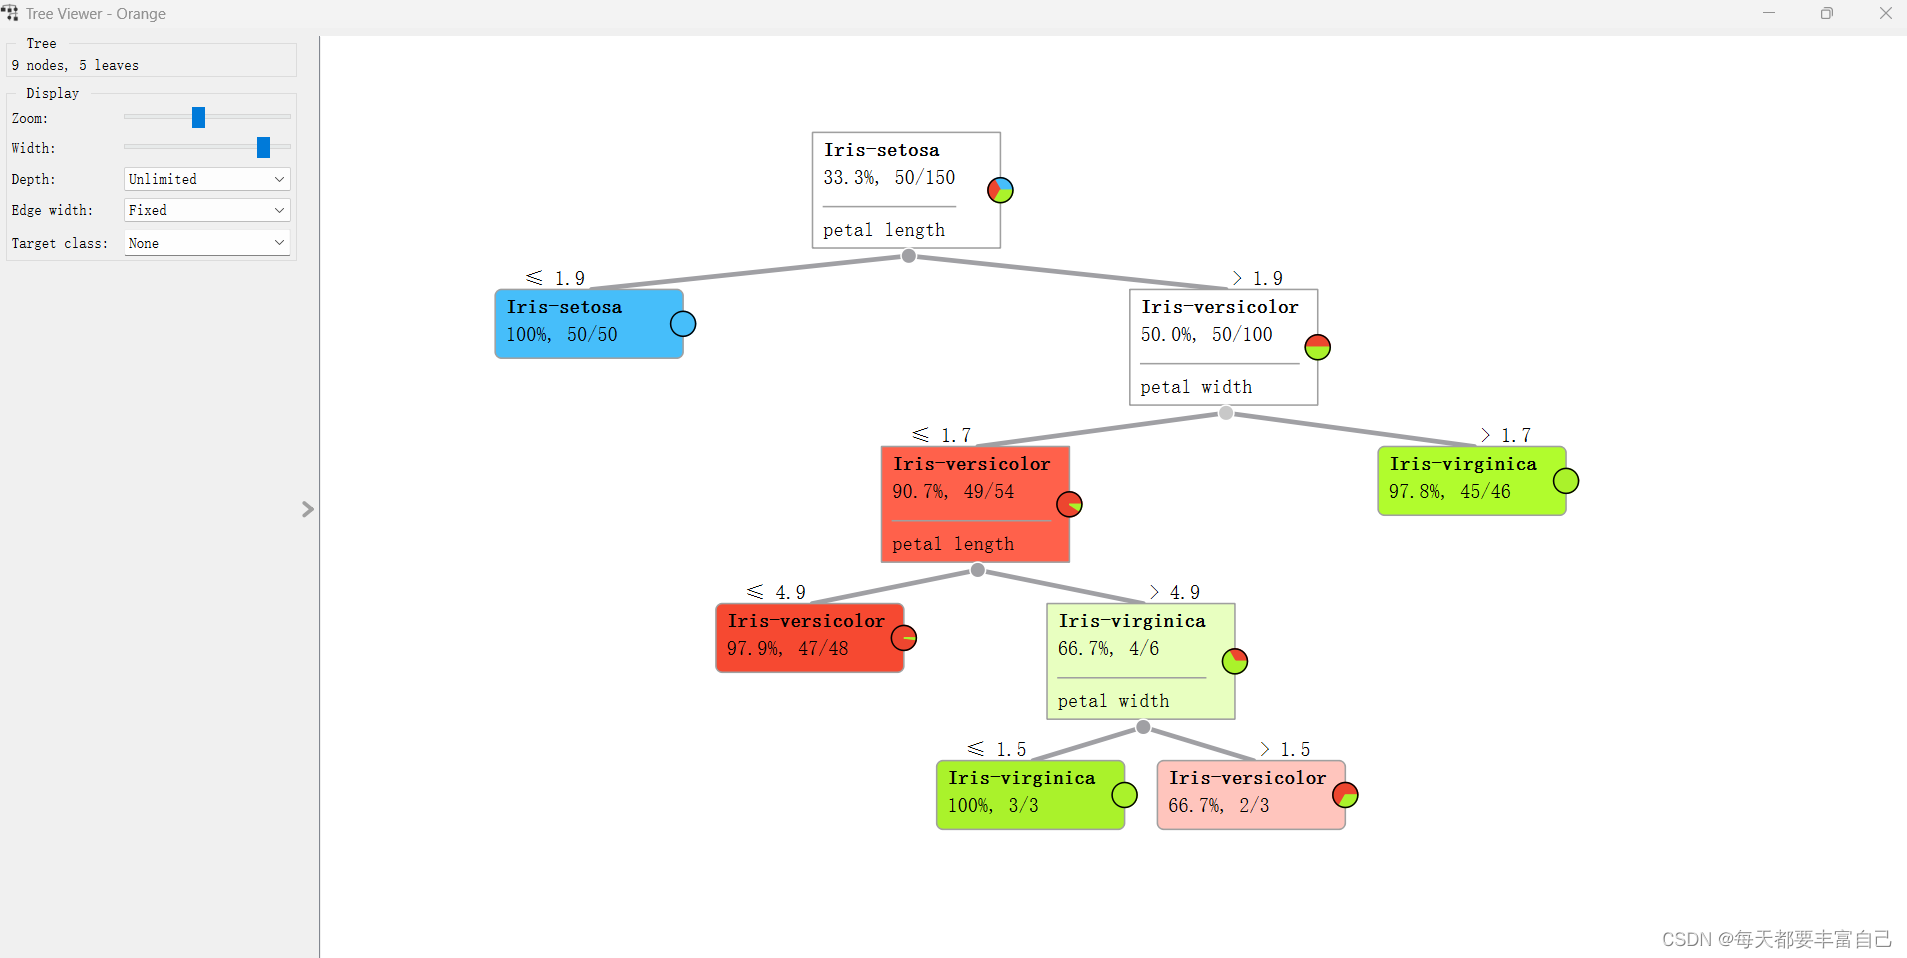
如图左上角所示: 9 nodes, 5leaves: 说明分了九个节点,5个叶子(个人理解,如图中所示,蓝色的没有继续往下进行分支的为叶子,leaves是nodes的一种),可以调试Tree中的不同参数,看一下不同参数对这个Tree的影响 Zoom\width是调节显示的,可以自行调节看一下区别
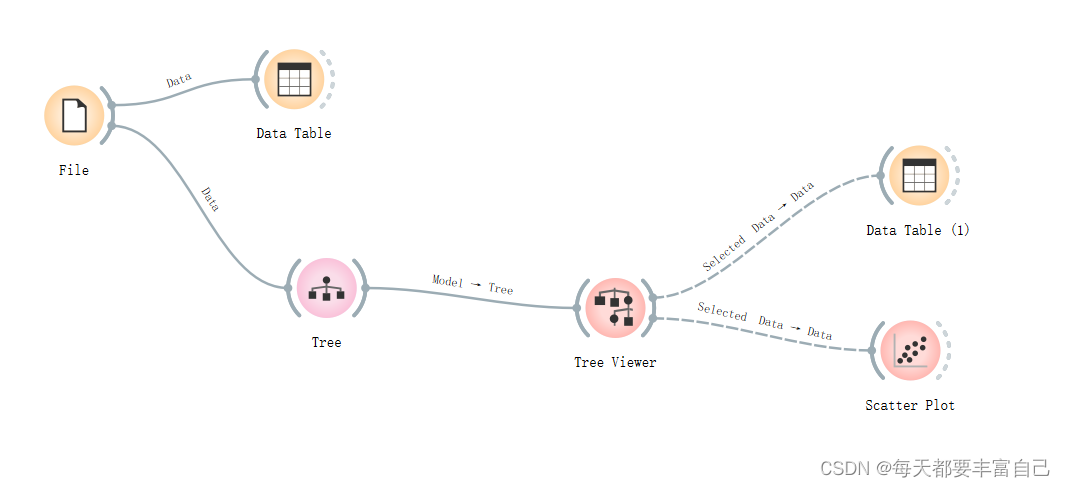
Tree viewer可以接DataTable和Scatter Plot模块
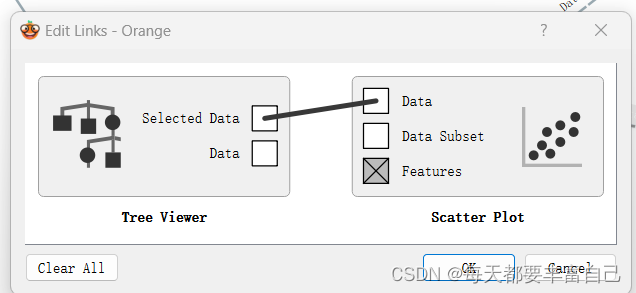
在Tree Viewer后面是Selected data --->data 以Scatter Plot为例,双击之后显示如下图所示:
没有显示什么信息 这时,双击Selected data --->data,如下图所示,
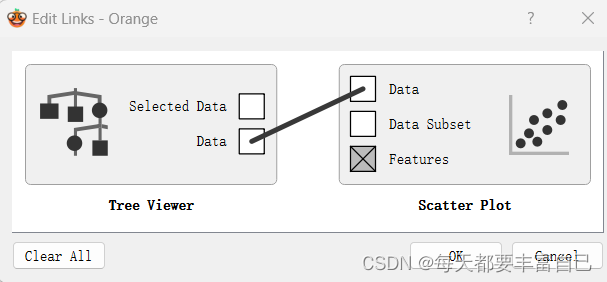
拖拽中间线的起点终点即可改成下图:
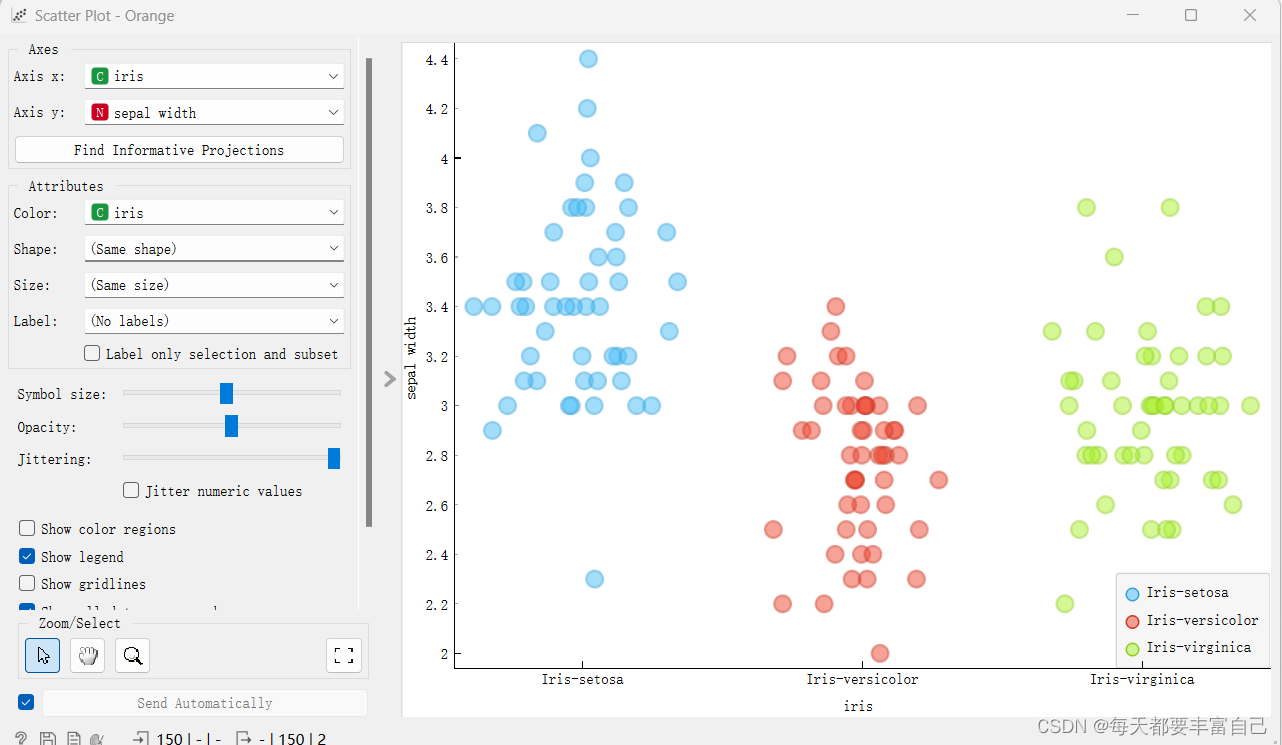
此时,再双击Scatter Plot,显示如下图所示:
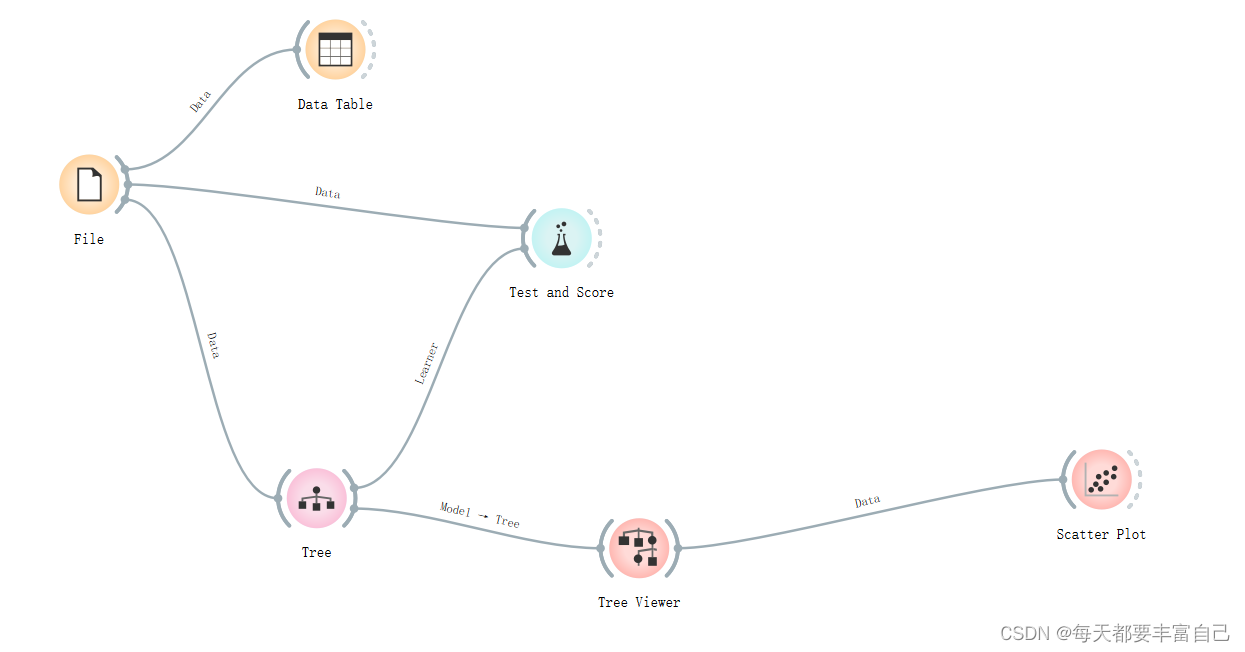
更改左侧的参数,调节不同显示效果 2.5 进行Test and Score那么模型建好了,如何来看模型的效果呢? 这个时候,我们选用Test and Score 模块,我是基于之前的步骤,继续进行,添加Test and Score模块,如下图所示
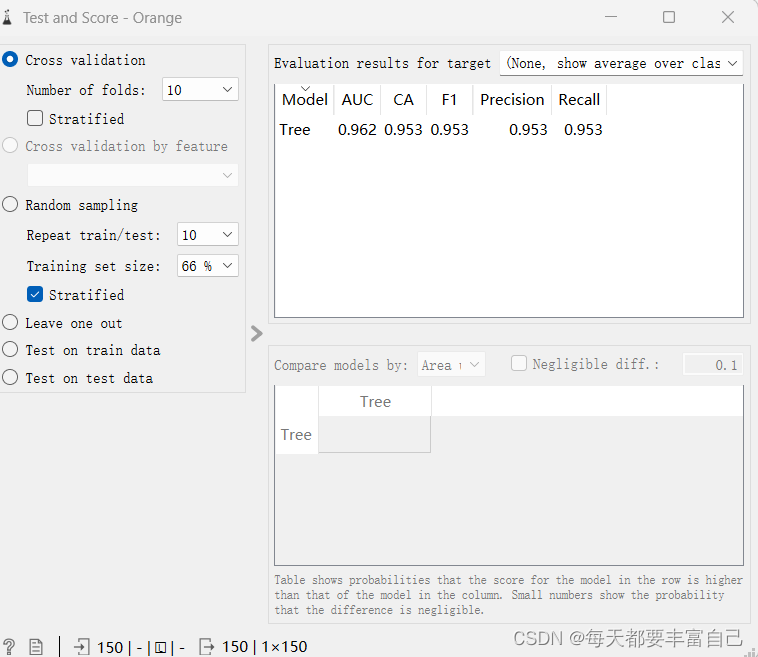
双击Testa and Score,重要参数有cross validation 就是交叉验证,具体参数,这里不做详细介绍 number of folds 是指验证的次数
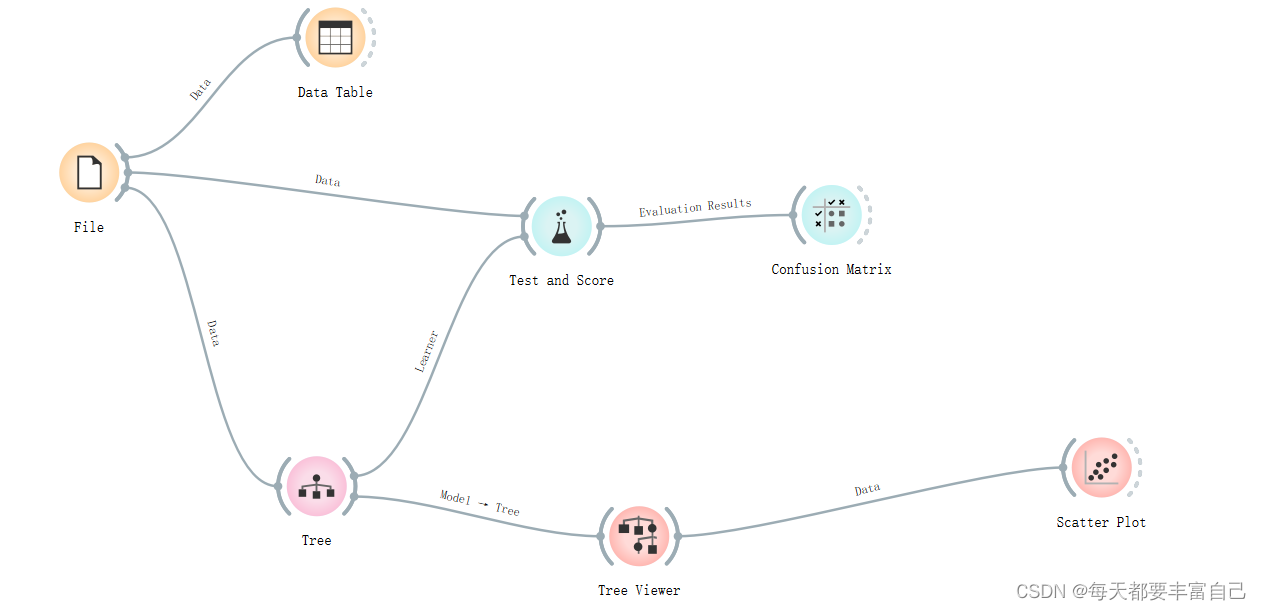
重要的结果参数: Area under ROC is the area under the receiver-operating curve.Classification accuracy is the proportion of correctly classified examples.F-1 is a weighted harmonic mean of precision and recall (see below).Precision is the proportion of true positives among instances classified as positive, e.g. the proportion of Iris virginica correctly identified as Iris virginica.Recall is the proportion of true positives among all positive instances in the data, e.g. the number of sick among all diagnosed as sick.Specificity is the proportion of true negatives among all negative instances, e.g. the number of non-sick among all diagnosed as non-sick.LogLoss or cross-entropy loss takes into account the uncertainty of your prediction based on how much it varies from the actual label.目前我也只了解CA (Classification accuracy)这个数,越大越精准,后续随着学习,会对这方面做一个更明晰的解释。可看出,该模型预测准确度在95.3% 在Test and Score之后,可添加Condfusion Matrix,看可视化的再现模拟的结果
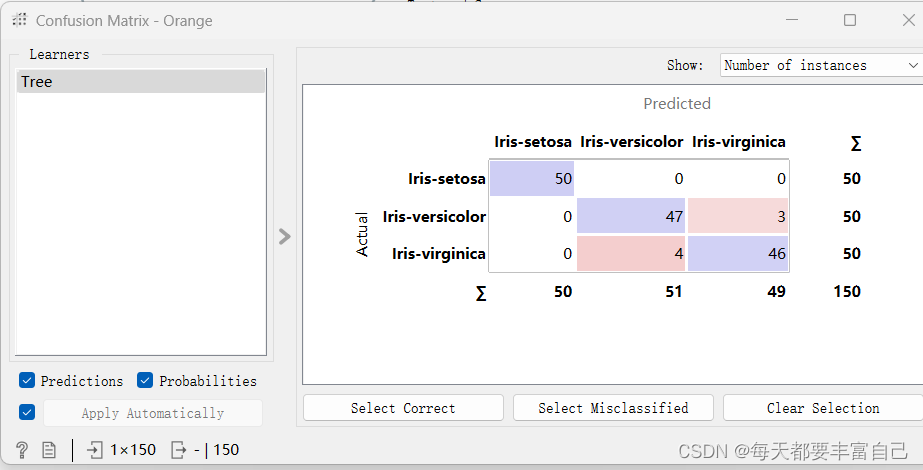
双击Confusion Matrix,如下图所示,Actual代表实际的真实的,Predicted代表模型预测的 Iris-setosa实际有50个,模型预测50个 Iris-versicolor实际50个,模型预测结果是51个,其中包括47个Iris-versicolor和4个错误的Iris-virginica Iris-virginica实际50个,模型预测结果是49个,其中包括46个Iris-virginica和3个错误的Iris-versicolor
今日份学习到此结束 |


【本文地址】
今日新闻 |
推荐新闻 |